|
| Ptolemy Geographia - decyphering Hibernia (Ireland) |
|---|
|
| Background |
|---|
Ptolemy was an astronomer and mathematician who probably worked in Alexandria between 127AD and 148AD, he wrote a number of Astonomical, Mathematical and Astrological books, and his Geographica (about 150AD) that describes the locations of towns, tribes and rivers across the Empire.
This document shows a way to decipher and understand the logic of the latitude and longitude measurements given in Claudius Ptolemy’s Geographia for the Island of Hibernia which is modern day Ireland.
Many people have tried to understand this, but as far as I know no one has yet used the following method.
|
| My Hypothesis ▲ |
|---|
That the latitude and longitudes quoted in the Geographia are not true latitudes and longitudes, but are calculated from a few known fixed locations.
This would mean that the variation in shapes from the real modern maps can be explained, and hence Settlement locations that have not yet been identified can be shown on modern maps.
|
| The Area I am interested in and why ▲ |
|---|
I am interested in the areas of Hibernia and Britannia because if they are plotted directly as latitudes and longitudes, they show marked differences from real latitude and longitude measurements, and also because I live in the South of England which has an unidentified Roman port of Novus Portus and would like to know where this was located to prove another hypothesis.
Ireland(Hibernia) is slightly offset, the southern part of Britannia shows a larger offset and Scotland appears to be rotated 90 degrees thus making this analysis more complex, so we will start with Hibernia(Ireland).
|
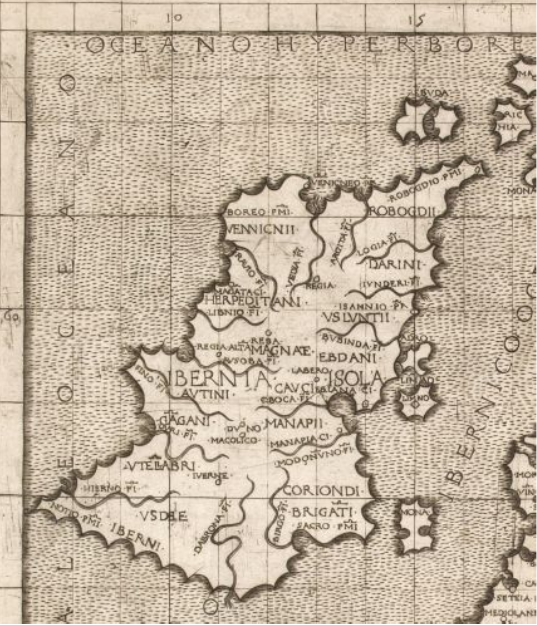
Image of Hibernia from Tabula Prima d'Europa, 1482AD
|
| |
|---|
| Background to Claudius Ptolemy’s Geographia ▲ |
|---|
The Geographia is the first known description of locations known by the Romans, this appears to have been compiled by Claudius Ptolemy of Alexandria in about 150AD. The text covers Europe, Africa and Asia showing that the Romans knew a high percentage of the Northern Hemisphere in which are shown towns, rivers and peninsulas'.
It is very likely that the text was produced for the Roman Military, and was also for identifying trading routes, and that the map was based on earlier maps, possibly by Marinus of Tyre or maybe earlier by the Carthaginians.
Ptolemy's work probably originally came with maps, but none have been discovered. Instead, the present form of the map was reconstructed from Ptolemy's coordinates by Byzantine monks under the direction of Maximus Planudes shortly after 1295AD.
The illustration below is the map produced by Ruysch in 1508AD, and graphically illustrates the extent of the text and the knowledge of the Romans from that period and was based on plotting the latitude and longitudes given in the text onto the world map.
|

Extract from Wikipedia
The Geography (Ancient Greek: Γεωγραφικὴ Ὑφήγησις, Geōgraphikḕ Hyphḗgēsis, lit. "Geographical Guidance"), also known by its Latin names as the Geographia and the Cosmographia, is a gazetteer, an atlas, and a treatise on cartography, compiling the geographical knowledge of the 2nd-century Roman Empire.
Originally written by Claudius Ptolemy in Greek at Alexandria around 150 AD, the work was a revision of a now-lost atlas by Marinus of Tyre using additional Roman and Persian gazetteers and new principles.[1] Its translation – Kitab Surat al-Ard – into Arabic by Al-Khwarismi in the 9th century was highly influential on the geographical knowledge and cartographic traditions of the Islamic world.
|
| Ptolemy Data Format ▲ |
|---|
The first thing to notice about the Ptolemy data is that the decimal points after the main number go to a maximum of .55 so it would seem logical to assume that each East/West segment was divided into six. Hence a section between 58 and 59 North and 10 to 11 East would consist of a 6 x 6 matrix (36 individual points) to provide granular accuracy, and if the entry went to .05 would allow even finer granularity (144 individual points).
However it would also seem that if a whole number with no decimal places is shown for example 11 East, that it could either be along the 11 line, or somewhere between 11 and 12 implying that the accuracy was not as good.
Summary:
If a number is displayed with a .05 accuracy it would probably mean that they were more confident of the data, if .1 then less so and finally if both were whole numbers then even less so.
This would mean in turn that the locations we should assume are the most accurate are those containing .05 entries, followed by those with .1 finally whole numbers.
|
| Analysis by other parties (Bill Thayer) ▲ |
|---|
There are a number of other people who have been interested in this subject and have tried analysing Ptolemy’s data with differing ways of plotting the variance between his data and current maps.
The very first of these modern plots that I have found in the early 2000’s was created by Bill Thayer in his massive LacusCurtius website, which I show below.
|
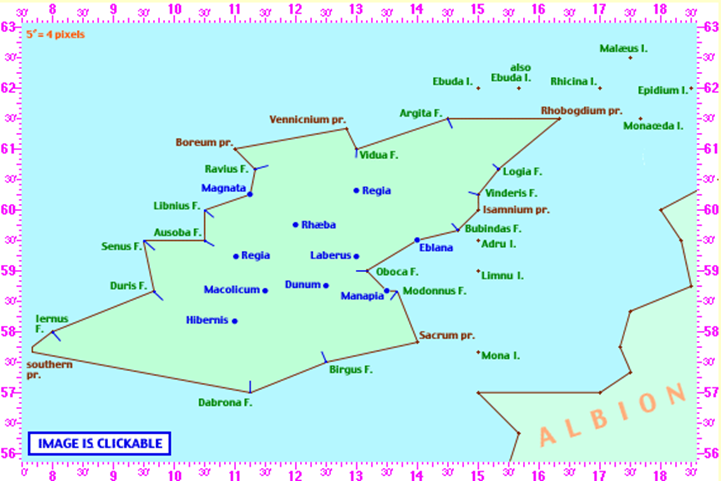
Bill plotted a number of maps from the Geographia, but decided that they were not particularly productive as most show significant differences from the real world, implying that this was too time consuming and not very useful for others looking at this subject.
The theory was that Ptolemy plotted real world latitudes and longitudes and these could be directly mapped.
|
| Analysis by other parties (R Darcy and W Flynn ) ▲ |
|---|
A later version of Bills analysis was carried out by R Darcy and W Flynn and published in 2008 and can be found here below, and shows an offset plot of Ptolemy’s data overlaid with the modern map.
|
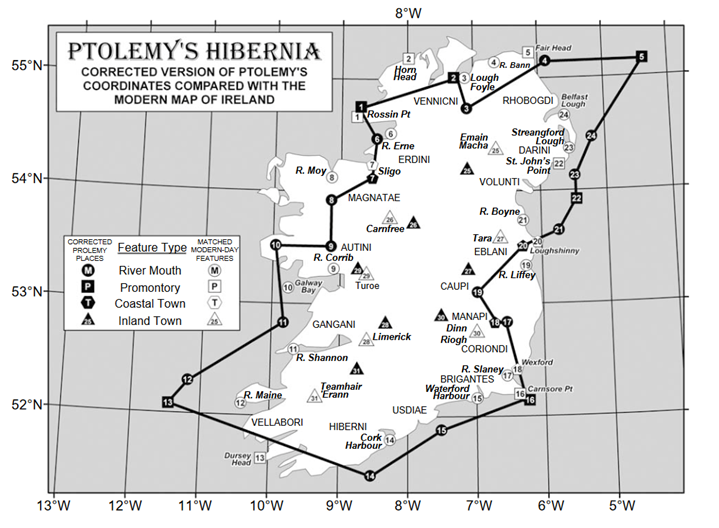
As you can see from the map, it still looks incorrect as per Bill Thayer’s version, as it uses the same premise that the latitudes and longitudes in the Geographia are the same as our modern ones.
|
| |
|---|
| My Analysis ▲ |
|---|
So it looks like plotting the latitude and longitudes directly onto the map is a waste of time, so lets plot the known places onto a map and then analyse in reverse. This may prove difficult as a number of Ptolemy’s locations are not easily identifiable, but we will give it a try and Hibernia does not have too many data points, which simplifies the analysis.
|
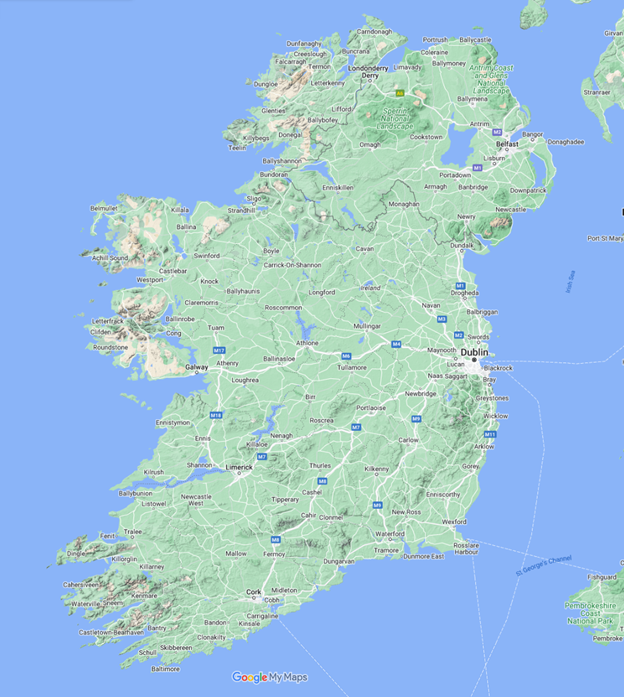
This is the modern map of Hibernia (Ireland) from Google My Maps
|
| |
|---|
| Ptolemy Raw Data ▲ |
|---|
| The following are the locations quoted by Ptolemy for Hibernia,
I have excluded those for the Islands north of Ireland, the Isle of Man and
also Anglesea. |
Please note: the red latitude longitude pairs are my suggested corrections after plotting on my last map .
|
| A description of the north coast, beyond which is located the Hyperborean ocean: |
| Boreum promontory |
11.00 |
61.00 |
(Bloody Foreland) |
| Vennicnium promontory |
12.50 |
61.20 |
(Malin Head) |
| mouth of the Vidua river |
13.00 |
61.00 |
(River Foyle) |
| mouth of the Argita river |
14.30 |
61.30 |
(Glengehesk river) |
| Rhobogdium promontory |
16.20 |
61.30 |
(Torr head) (14.20 61.30) |
| |
| The Vennicni inhabit the west coast; next to them and toward the
east are the Rhobogdi |
| |
| A
description of the west side, which borders on the Western ocean from
the |
| Boreum promontory |
11.00 |
61.00 |
(Bloody Foreland) |
| mouth of the Ravius river |
11.20 |
60.40 |
(River Earn) |
| Magnata city |
11.15 |
60.15 |
(Cullenamore) |
| mouth of the Libnius river |
10.30 |
60.00 |
(River More) |
| mouth of the Ausoba river |
10.30 |
59.30 |
(River Corrib) |
| mouth of the Senus river |
9.30 |
59.30 |
(River Shannon) |
| mouth of the Duris river |
9.40 |
58.40 |
(Inagh river) |
| mouth of the Iernus river |
8.00 |
58.00 |
(River Maine) |
| Southern promontory |
7.40 |
57.45 |
(Ducalla) |
| |
| The
Erdini inhabit the coast next to the Vennicni, and between these are the
Magnatae; then the Autini; and the Gangani; below whom are the Vellabori |
| |
| Description
of the south coast, which adjoins the Vergionius ocean, |
| Southern promontory |
7.40 |
57.40 |
(Ducalla) |
| mouth of the Dabrona river |
11.15 |
57.00 |
(River Lee) |
| mouth of the Birgus river |
12.30 |
57.30 |
(River Barrow) (13.30 57.30)
|
| Sacrum promontory |
14.00 |
57.50 |
(Carnsore Point) |
| |
| A
description of the east side touching the ocean which is called Hibernian, |
| Sacrum promontory
|
14.00 |
57.50 |
(Carnsore Point) |
| mouth of the Modonnus river
|
13.40 |
58.40 |
(River Slaney) |
| Manapia town
|
13.30 |
58.40 |
(Wexford) |
| mouth of the Oboca river
|
13.10 |
59.00 |
(River Liffey) (14.1 59.00) |
| Eblana town
|
14.00 |
59.30 |
(Drogheda) |
| mouth of the Bubindas river
|
14.40 |
59.40 |
(Newry River) |
| Isamnium promontory
|
15.00 |
60.00 |
(St John's Point) |
| mouth of the Vinderis river
|
15.00 |
60.15 |
(Comber River) |
| mouth of the Logia river
|
15.20 |
60.40 |
(River Lagan) |
| |
| Next to this
is the Robogdium promontory |
| |
| On
the side next to the Robogdi dwell the Darini, below whom are the Volunti;
then the Eblani; then the Cauci; below whom are the Manapi; then the Coriondi
who dwell above the Brigantes |
|
| |
|---|
| Map showing identified locations ▲ |
|---|
This map shows the points from Ptolemy data as above, I have plotted them using my interpretation of their details, and in places where I had difficulties referred to other online sites to allow me to corroborate the data points. There will be some wrong due to transcription errors over time, and also location misunderstandings.
|
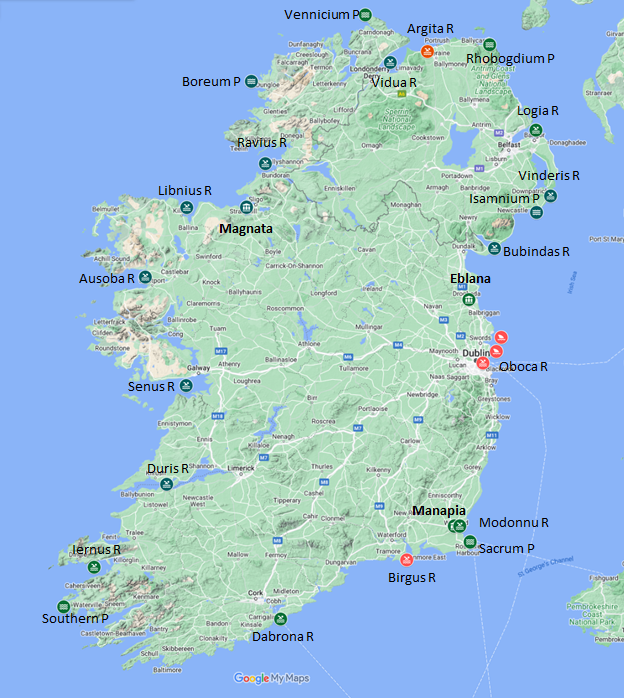
The plot of known locations on Google My Maps
|
| |
|---|
| Overlay Latitude(North/South) lines ▲ |
|---|
Now if I take all the latitudes(North/South) recorded in the Geographia and join the ones with the same latitude I get the following plot, these latitudes are not parallel with our modern ones, but this is interesting, well it is to me. To the left of the latitude lines are the Ptolemy latitudes.
|
| |
|---|
Background ▲
|
|---|
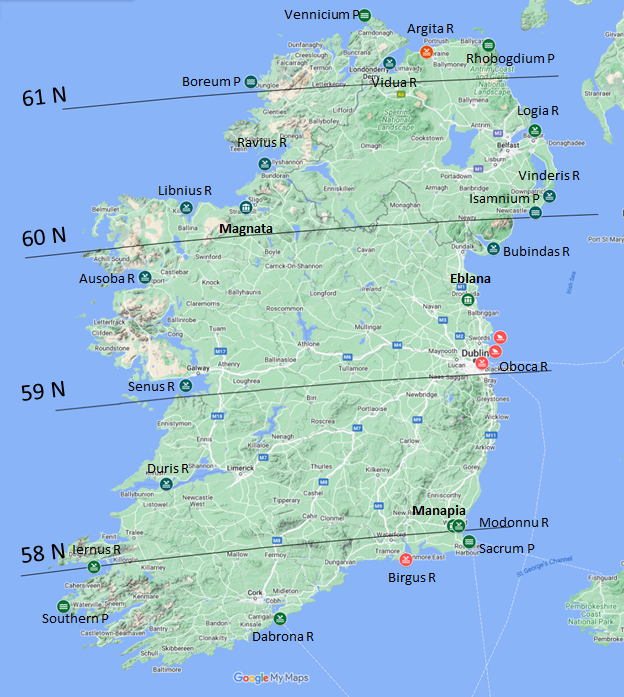
The plot of latitudes on Google My Maps
|
| |
|---|
| Overlay Longitude(East/West) lines ▲ |
|---|
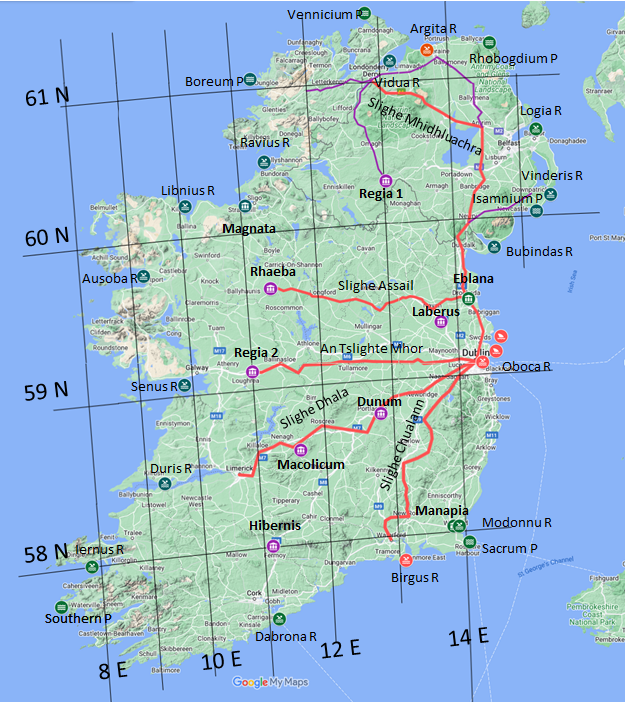
Now to build up the blocks lets add the Longitude(East/West) lines running at 90 degrees to the north lines. The numbers at the bottom of the screen marked 8 - 14E shows Ptolemy degrees East. This grid seems to give quite a a good correlation with the Ptolemy points already plotted on the map.
|
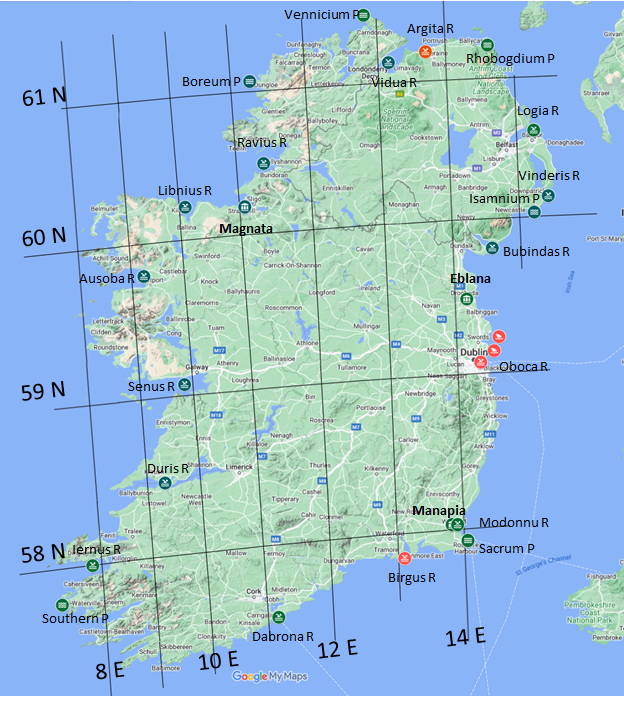
The plot of latitudes and longitudes on Google My Maps
|
| |
|---|
| Celtic main roads in Roman times ▲ |
|---|
This map is now overlaid by the five main Celtic road routes in Ireland in Roman times, these are north to south, Slighe Mhidhluachra, Slighe Assail, An Tslighte Mhor, Slighe Dhala and Slighe Chualann.
|
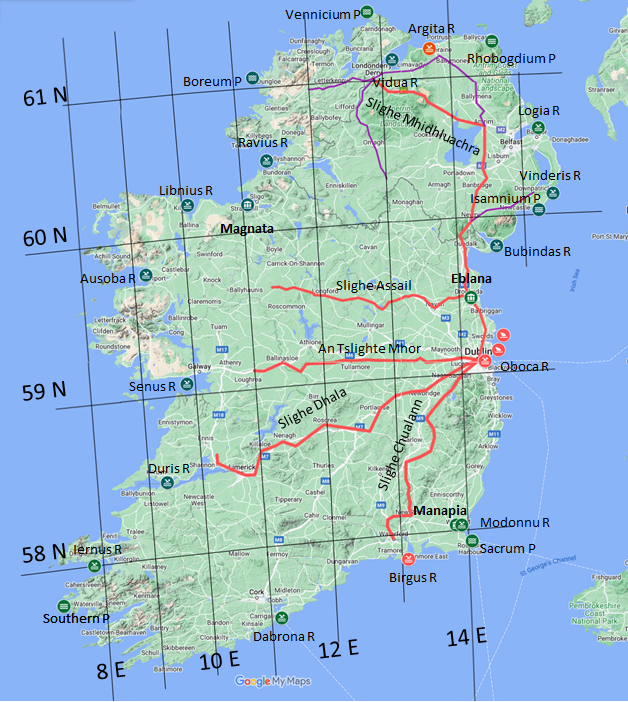
|
Source for the Road map ▲
|
|---|
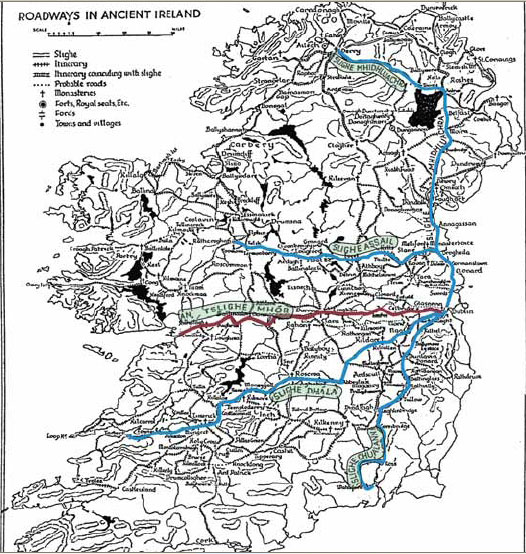
The data for my road map has been derived from the map above from tarataratara.net
|
| Celtic Hillforts and their relationship to Roman place names ▲ |
|---|
I have plotted the following inland towns after creating the grid, as it was difficult identifying these as modern locations, and have plotted these onto hillforts that are in the area as these are the most likely places for settlement locations.
All the hillfort information comes from the Atlas of Hillforts from Oxford University.
|
| Inland Towns ▲ |
|---|
| |
| The
following are the probable locations for the inland towns: |
| Regia |
13.00 |
60.20 |
(NI0813 Clogher, Tyrone) |
| Rhaeba |
12.00 |
59.45 |
(IR0990 Castleruby, Roscommon) |
| Laberus |
13.00 |
59.15 |
(IR1029 Garristown, Dublin, Tara) |
| Macolicum |
11.30 |
58.40 |
(IR0710 Garrangrena Lower, Tipperary) |
| another Regia |
11.00 |
59.15 |
(IR0737 Rahally, Galway) |
| Dunum |
12.30 |
58.45 |
(Rock of Dunamase, Portlaoise) |
| Hibernis |
11.00 |
58.10 |
(IR0801 Mooghaun, Clare) |
|
|
Another really interesting Ptolemy map from Danann_Celt ▲
|
|---|
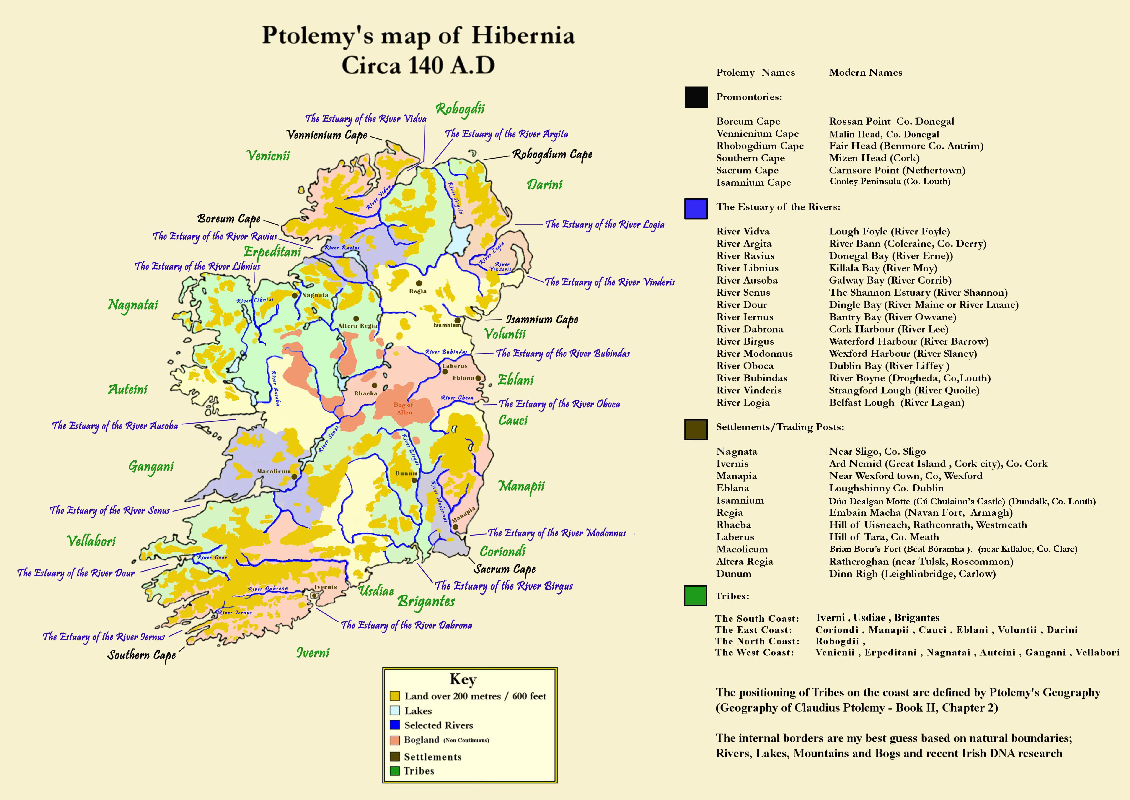
This excellent map can be found on Reddit produced by Dannan_Celt. |
| |
|---|
| Final Observations ▲ |
|---|
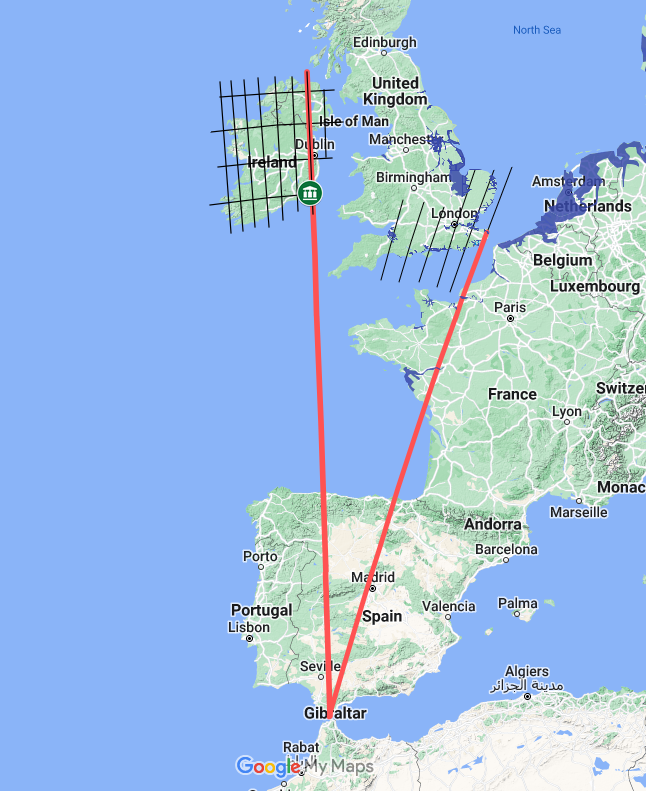
This map shows the Irish latitude/longitudes, and also some of the southern Britannia lines using the same logic.
The north south line taken from Wexford goes down to Cadiz and the 55 degree north line joins britannia in Colchester (Camulodunum).
The map of Britannia changes north of line from Caistor on Sea or Burgh Castle(Gariannonum)to Wexford.
All Britannia north south lines above Burgh Castle appear to be calculated from Wexford see the lines marked 55 to 59.
If this is the case then then somewhere in the Wexford area was a major Roman port, with links to Cadiz in Southern Spain and to both Colchester and Burgh Castle.
Please Note:
This may just be a co-incidence but brings the possibility that the measurements for Hibernia and the south of Britannia originate from Cadiz in the South of Spain, which was a very important port for the Romans with an accurately known location.
|
|
| Conclusion ▲ |
|---|
From the above argument it would seem that it is possible to fairly accurately map Ptolemy's Geographia data, and that it is very likely that the origin of the latitudes and longitudes was based on calculation from a few fixed locations.
In the case of Albion and Southern Britannia that these were calculated from Roman Gades (modern Cadiz) in the South of Spain, Wexford in Eire and Colchester and Burgh Castle in Britain.
Also it would seem that somewhere near Wexford was a major Roman mapping harbour as it sees to be the originating point for a lot of the lines in Britannia.
For more details on the Roman mapping of Britain please click on the button below
|