| Ptolemy Geographia - deciphering Caledonia(Scotland) |
|---|
| Background |
|---|
Ptolemy was an astronomer and mathematician who probably worked in Alexandria between 127AD and 148AD, he wrote a number of Astronomical, Mathematical and Astrological books, and his Geographica (about 150AD) that describes the locations of towns, tribes and rivers across the Empire.
This document shows a way to decipher and understand the logic of the latitude and longitude measurements given in Claudius Ptolemy’s Geographia for the Island of Hibernia which is modern day Ireland.
Many people have tried to understand this, but as far as I know no one has yet used the following method.
| My Hypothesis ▲ |
|---|
That the latitude and longitudes quoted in the Geographia are not true latitudes and longitudes, but are calculated from a few known fixed locations.
This would mean that the variation in shapes from the real modern maps can be explained, and hence Settlement locations that have not yet been identified can be shown on modern maps.
| Ptolemy Data Format ▲ |
|---|
The first thing to notice about the Ptolemy data is that the decimal points after the main number go to a maximum of .55 so it would seem logical to assume that each East/West segment was divided into six. Hence a section between 58 and 59 North and 10 to 11 East would consist of a 6 x 6 matrix (36 individual points) to provide granular accuracy, and if the entry went to .05 would allow even finer granularity (144 individual points).
However it would also seem that if a whole number with no decimal places is shown for example 11 East, that it could either be along the 11 line, or somewhere between 11 and 12 implying that the accuracy was not as good.
Summary:
If a number is displayed with a .05 accuracy it would probably mean that they were more confident of the data, if .1 then less so and finally if both were whole numbers then even less so.
This would mean in turn that the locations we should assume are the most accurate are those containing .05 entries, followed by those with .1 finally whole numbers.
| Analysis by other parties (Bill Thayer) ▲ |
|---|
There are a number of other people who have been interested in this subject and have tried analysing Ptolemy’s data with differing ways of plotting the variance between his data and current maps.
The very first of these modern plots that I have found in the early 2000’s was created by Bill Thayer in his massive LacusCurtius website, which I show below.
| 
Bill plotted a number of maps from the Geographia, but decided that they were not particularly productive as most show significant differences from the real world, implying that this was too time consuming and not very useful for others looking at this subject.
The theory was that Ptolemy plotted real world latitudes and longitudes and these could be directly mapped.
| Ptolemy Raw Data ▲ |
|---|
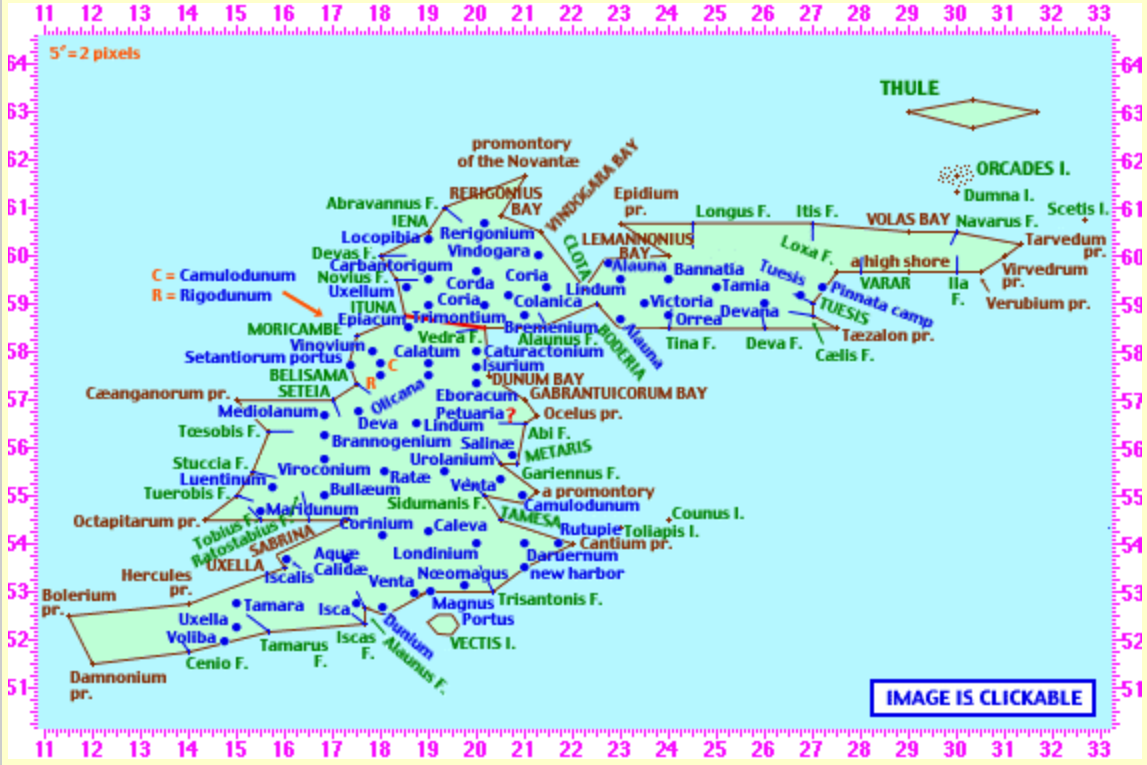
The following are the locations quoted by Ptolemy for Albion, I have excluded those for Scotland as these appear to need a separate analysis.
Please note: the red latitude longitude pairs are my suggested corrections after plotting on my last map.
A description of the northern coast, above which is the Duecaledonius ocean. |
| Novantarum peninsula, and promontory of the same name | 21*00 | 61°40(Mull of Galloway) |
|---|
| Rerigonius bay | 20*30 | 60°50(Loch ryan) |
|---|
| Vindogara bay | 21*20 | 60°30(Irvine bay) |
|---|
| Clota estuary | 22*15 | 59°20(Firth of Clyde) |
|---|
| Lemannonius bay | 24*00 | 60°00(Near Prestwick) |
|---|
| Epidium promontory | 23*00 | 60°40(Mull of Kintyre) |
|---|
| mouth of the Longus river | 24*30 | 60°40(Loch Linnhe) |
|---|
| mouth of the Itis river | 27*00 | 60°40(Loch Ewe) |
|---|
| Volas bay | 29*00 | 60°30(Loch Eriboll) |
|---|
| mouth of the Navarus river | 30*00 | 60°30(River naver) |
|---|
| Tarvedum or Orcas promontory | 31*20 | 60°15(dunnet head) |
|---|
Description of the west a side which borders on the Hibernian ocean and the Vergionius ocean. |
| From the Novantian promontory | 21*00 | 61°40(Mull of Galloway) |
|---|
| mouth of the Abravannus river | 19*20 | 61°00(Gillespie Burn) |
|---|
| Iena estuary | 19*00 | 60°30(River Cree) |
|---|
| mouth of the Devas river | 18*00 | 60°00(River Dee) |
|---|
| mouth of the Novius river | 18*20 | 59°30(River Nith) |
|---|
| Ituna estuary | 18*30 | 58°45(Solway Firth) |
|---|
| Moricambe estuary | 17*30 | 58°20(morcambe bay) |
|---|
| Setantiorum harbor b | 17*20 | 57°45(Skipool - Fleetwood) |
|---|
| Belisama estuary | 17*30 | 57°20(river ribble) |
|---|
| Seteia estuary | 17*00 | 57°00(river mersey) |
|---|
| Caeanganorum promontory | 15*00 | 57°00(Great Orme) |
|---|
| mouth of the Toesobis river | 15*40 | 56°20(Tremadog Bay) |
|---|
| mouth of the Stuccia river | 15*20 | 55°30(Afon Dyfi) |
|---|
| mouth of the Tuerobis river | 15*00 | 55°00(Afon Ystwyth) |
|---|
| Octapitarum promontory | 14*20 | 54°30(St Davids Head) |
|---|
| mouth of the Tobius river | 15*30 | 54°30(River Loughor) |
|---|
| mouth of the Ratostabius river | 16*30 | 54°30(River Usk) |
|---|
| Sabrina estuary | 17*20 | 54°30(River Severn) |
|---|
| Uxella estuary | 16*00 | 53°30(River Axe) |
|---|
| Herculis promontory | 14*00 | 52°45(Hartland point) |
|---|
| Antivestaeum or Bolerium promontory | 11*30 | 52°30(Lands End) |
|---|
| Damnonium or Ocrium promontory | 12*00 | 51°30(Lizard Point) |
|---|
Description of the south side below which is the Britannic ocean. After the Ocrium promontory is |
| the mouth of the Cenio river | 14*51 | 51°45(River Fal or Fowey) |
|---|
| mouth of the Tamarus river | 15*40 | 52°10(River Tamar) |
|---|
| mouth of the Iscas river | 17*40 | 52°20(River Exe) |
|---|
| mouth of the Alaunus river | 17*40 | 52°40(River Axe) |
|---|
| Magnus Portus | 19*00 | 53°00(Portchester) |
|---|
| mouth of the Trisantonis river | 20*20 | 53°00(River Arun) |
|---|
| New harbor(Novus Portus) | 21*00 | 53°30(Pevensey) |
|---|
| Cantium promontory | 22*00 | 54°00(South Foreland) |
|---|
A description of the eastern and the southern side next to which is the Germanic ocean. After the Tarvedum promontory, or Orcades, by which it is known, |
| Virvedrum promontory | 31*00 | 60°00(Duncansby Head) |
|---|
| Verubium promontory | 30*30 | 59°40(Noss Head) |
|---|
| mouth of the Ila river | 30*00 | 59°40(River Helmsdale) |
|---|
| a high shore | 29*00 | 59°40(Balintore) |
|---|
| Varar estuary | 28*00 e | 59°40(Beauly Firth) |
|---|
| mouth of the Loxa river | 27*30 | 59°40(River Lossie) |
|---|
| Tuesis estuary | 27*00 | 59°00(River Spey) |
|---|
| mouth of the Caelis river | 27*00 | 58°45(River Deveron) |
|---|
| Taezalon promontory | 27*30 | 58°30(Kinnairds Head) |
|---|
| mouth of the Deva river | 26*00 | 58°30(River Dee) |
|---|
| mouth of the Tina river | 24*00 | 58°30(River tay) |
|---|
| Boderia estuary | 22*30 | 59°00(Firth of Forth) |
|---|
| mouth of the Alaunus river | 21*20 | 58°30(River Aln) |
|---|
| mouth of the Vedra river | 20*10 | 58°30(River Wear) |
|---|
| Dunum bay | 20*15 | 57°30(Tees Bay) |
|---|
| Gabrantuicorum bay with many harbors | 21*00 | 57°00(South of Flamborough head) |
|---|
| Ocelus promontory | 21*15 | 56°40(near withernsea) |
|---|
| mouth of the Abi river | 21*00 | 56°30(The Humber) |
|---|
| Metaris estuary | 20*30 | 55°40(The Wash) |
|---|
| mouth of the Gariennus river | 20*50 | 55°40(River Yare) |
|---|
| A promontory | 21*15 | 55°05(Felixstowe) |
|---|
| mouth of the Sidumanis river | 20*10 | 55°00(river colne) |
|---|
| Tamesa estuary | 20*30 | 54°30(Thames) |
|---|
| Next to this the Cantium promontory | 22*00 | 54°00(South Foreland) |
|---|
The Novantae dwell on the side toward the north below the peninsula of this name, among whom are the following towns: |
| Locopibia | 19*00 | 60°20(Mull of Galloway Promontory Fort) |
|---|
| Rerigonium | 20*10 | 60°40(Stranraer) |
|---|
Below are the Selgovae, among whom are the following towns: |
| Carbantorigum | 19*00 | 59°30(Whithorn Promontary fort) |
|---|
| Uxellum | 18*30 | 59°20(Glenrochar Roman Fort) |
|---|
| Corda | 20*00 | 59°40(Corridoo) |
|---|
| Trimontium | 19*00 | 59°00(Wardlaw Hillfort/font>) |
|---|
From these toward the east, but more northerly, are the Damnoni, among whom are the following towns: |
| Colanica | 20*45 | 59°10(Selkirk) |
|---|
| Vindogara | 21*20 | 60°00(Avisyard Hill) |
|---|
| Coria | 21*30 | 59°10(Carronbridge) |
|---|
| Alauna | 22*45 | 59°50(Edinburgh) |
|---|
| Lindum | 23*00 | 59°30(Bonnytown fort) |
|---|
| Victoria | 23*30 | 59°00(Fast Castle) |
|---|
Further south are the Otalini, among whom are the following towns: |
| Corstopitum | 20*10 | 20*10(corbridge?) |
|---|
| Alauna | 23*00 | 23*00(Learchild ?) |
|---|
| Bremenium | 21*00 | 58°45(High Rochester) |
|---|
Next to the Damnoni, but more toward the east near the Epidium promontory are the Epidi and next to these the Cerones; then the Carnonacae, and the Caereni but more toward the east; and in the extreme east dwell the Cornavi; from the Lemannonis bay as far as the Varar estuary are the Caledoni, and above these is the Caledonian forest, from which toward the east are the Decantae, and next to these the Lugi extending to the Cornavi boundary, and above the Lugi are the Smertae; below Caledonia are the Vacomagi, among whom are the following towns: |
| Bannatia | 24*00 | 24*00(?) |
|---|
| Tamia | 25*00 | 25*00(?) |
|---|
| Pinnata camp | 27*15 | 59°20(Tayside) |
|---|
| Tuesis | 26*45 | 26*45(?) |
|---|
Below these toward the west are the Venicones, whose town is |
| Orrea | 24*00 | 58°45(Carpow) |
|---|
More toward the east are the Taezali |
| and the town Devana | 26*00 | 59°00(Chester) |
|---|
Below the Selgovae and Otalini f are the Brigantes extending to both seas, among whom are the following towns: |
| Epiacum | 18*30 | 58°30(Whitley Castle) |
|---|
| Vinovium | 17*45 | 58°00(Binchester) |
|---|
| Caturactonium | 20*00 | 58°00(Catterick) |
|---|
| Calatum | 19*00 | 19*00(?) |
|---|
| Isurium | 20*00 | 57°40(Aldborough) |
|---|
| Rigodunum | 18*00 | 18*00(?) |
|---|
| Olicana | 19*00 | 19*00(?) |
|---|
| Eboracum, Legio VI Victrix | 20*00 | 57°20(York) |
|---|
Near which on the Opportunum bay are the Parisi and the town |
| Petuaria | 20*40 | 56°40 g (Brough on Humber) |
|---|
Below these are the Brigantes but some distance toward the west are the Ordovices, among whom are the towns: |
| Mediolanum | 16*45 | 16*45(?) |
|---|
| Brannogenium | 16*45 | 56°15(Leintwardine) |
|---|
From these toward the east are the Cornavi, among whom are the towns: |
| Deva, Legio XX Victrix | 17*30 | 56°45(Chester) |
|---|
| Viroconium | 16*45 | 55°45(Wroxeter) |
|---|
Next to these are the Coritani, among whom are the towns: |
| Lindum | 18*40 | 56°30(Lincoln) |
|---|
| Ratae | 18*00 | 55°30(Leicester) |
|---|
Next are the Catuvellauni, among whom are the towns: |
| Salinae | 20*45 | 20*45(?) |
|---|
| Urolanium | 19*20 | 55°30(St Albans) |
|---|
Next to these are the Iceni, |
Farther eastward and near the estuary of the Tamesa are the Trinovantes |
| and the town Camulodunum | 21*00 | 55°00(Colchester) |
|---|
Below the peoples we have mentioned, but more toward the west are the Demetae, whose towns are: |
| Luentinum | 15*45 | 55°10(Pumsaint) |
|---|
| Maridunum | 15*30 | 54°40(Carmarthen) |
|---|
More toward the east are the Silures |
| whose town is Bullaeum | 16*50 | 55°00(Usk) |
|---|
Next to these are the Dobuni, |
| and their town Corinium | 18*00 | 54°10(Cirencester) |
|---|
then the Atrebati |
| and their town Caleva | 19*00 | 54°15(Silchester) |
|---|
Next to these, but farther eastward, are the Canti among whom are the towns: |
| Londinium | 20*00 | 54°00(London) |
|---|
| Daruernum | 21*00 | 54°00(Canterbury) |
|---|
| Rutupie | 21*45 | 54°00(Richborough) |
|---|
Below the Atrebati and the Canti are the Regni and the town |
| Noeomagus | 19*45 | 53°05(Chichester) |
|---|
Below the Dobuni are the Belgae and the towns: |
| Iscalis | 16*00 | 53°40(Dowsborough hill fort) |
|---|
| Aquae calidae | 17*20 | 53°40(Bath) |
|---|
| Venta | 18*40 | 53°00(Winchester) |
|---|
Toward the west and south of these are the Durotriges whose town is |
| Dunium | 18*00 | 52°40(Hods hill) |
|---|
Next to these, but more to the west, are the Dumnoni, whose towns are: |
| Voliba | 14*45 | 52°00(Castle an Dinas) |
|---|
| Uxella | 15*00 | 52°45(Launceston) |
|---|
| Tamara | 15*00 | 52°15(Plymouth) |
|---|
| Isca, where is located Legio II Augusta | 17*30 | 52°45(Exeter) |
|---|
The islands which are near Albion island and the Orcades promontory are: |
| Scetis island | 32*40 | 60°45(Skye) |
|---|
Eastward from the Trinovantes region there are two islands: |
Below Magnus Portus is the island Vectis, |
| the middle of which is in | 19*20 | 52°20(Blackwater) |
|---|
Above these islands are the Orcades, about thirty in number, |
| the middle of which is in | 30*00 | 61°40(Orkney) |
|---|
| Plotting latitudes ▲ |
|---|
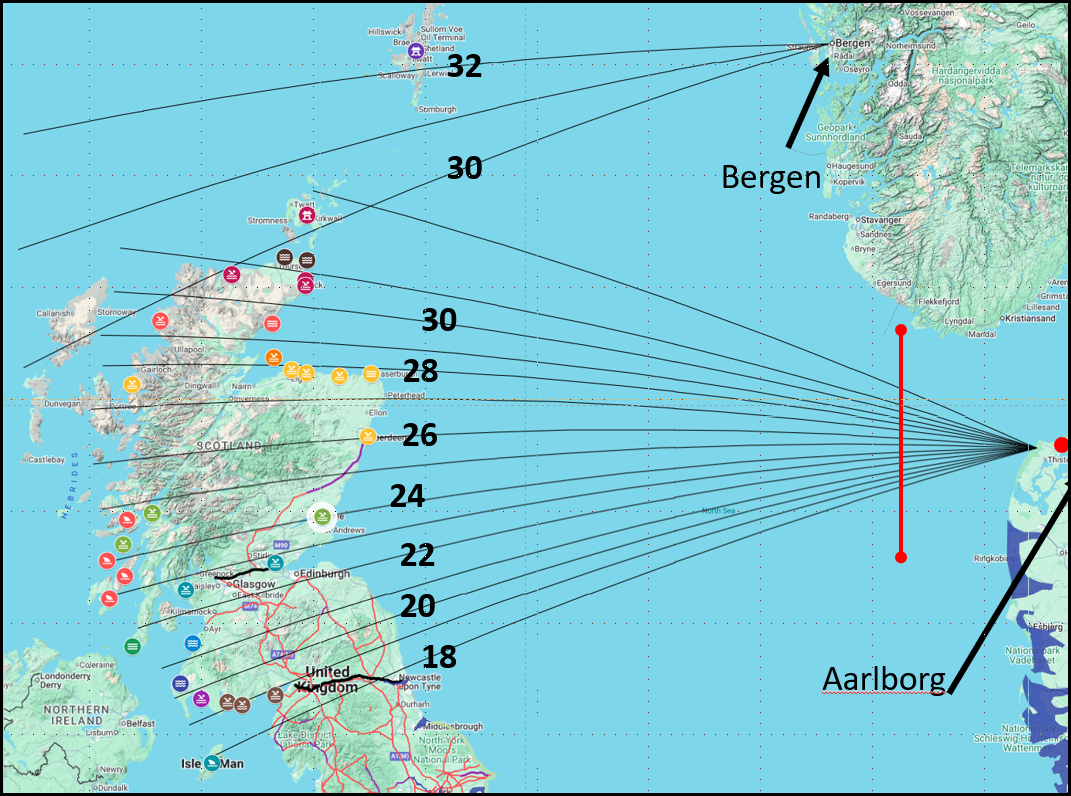
Firstly I have coloured all the locations with the same latitude? in the same colour to try to find an originating point.
From the tracks of the latitudes? it would seem that these originate from the top of the coast in Denmark or possibly Aalborg. There is a possibility that this originating point could be the South of Sweden but this is much less likely.
It also looks like the northern islands are measured from Bergen, but there are few to be certain of this and they may just have been recorded incorrectly.
There are a few inconsistencies such as the islands on the west coast marked in red that must have a different origination point.
| Plotting longitudes ▲ |
|---|
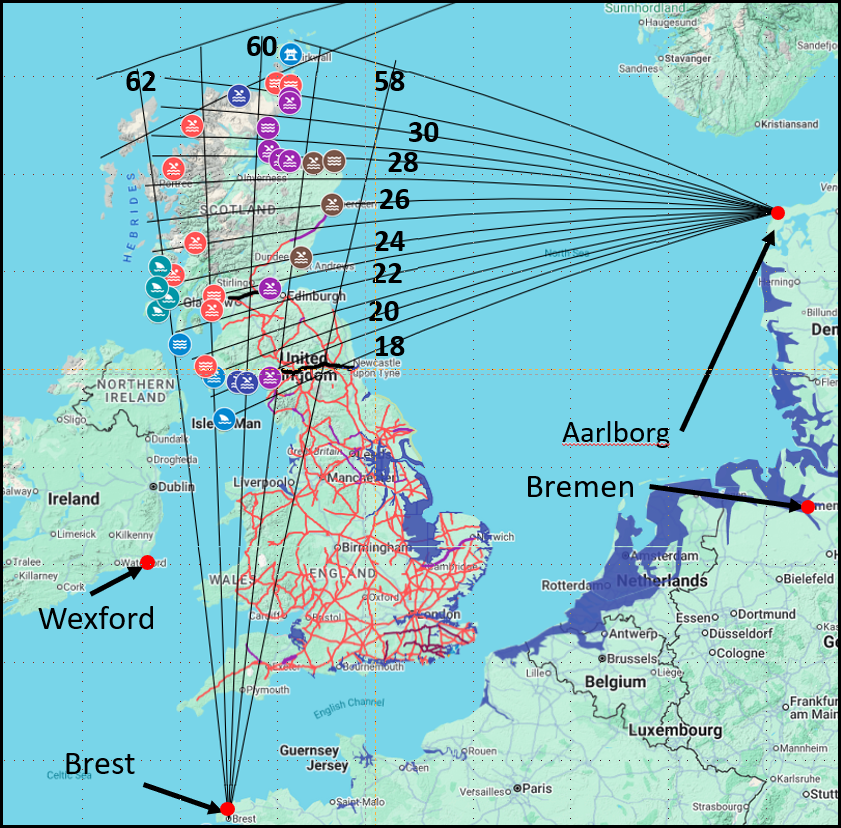
Firstly I have coloured all the locations with the same longitude? in the same colour to try to find an originating point.
From the tracks of the latitudes? it would seem that these originate from Northern France near Brest.
As you can see from the latitude numbers they are backwards, therefore my assumption is that the whole of Scotland has been rotated towards the right, how would this be possible ?
Let us now make a large assumption that if Scotland is rotated, then the two points that make the Scottish grid were plotted from incorrect points. The distance between Aalborg and Brest is about 1300 Km and that from Bremen to Wexford is just under 1100 Km so it is possible that Ptolemy made the assumption that the data from Brest originated in Wexford and the data from Aalborg originated in Bremen.
This in turn would imply that the data:
- Was plotted from the wrong locations, i.e Wexford not Brest and Bremen not Aalborg
- Wasn't Roman as they would have been more accurate and would have known the originating locations.
- This in turn could imply that the data was from Pytheas who had travelled in this area about 330BC, but his stopping points were not known by Ptolemy, who assumed that his locations were the same as major Roman ports.
Let us assume the above statements are correct what would the map of Great Britain look like.
| Theoretical map of Britain if Wexford and Bremen are used as the recording points ▲ |
|---|
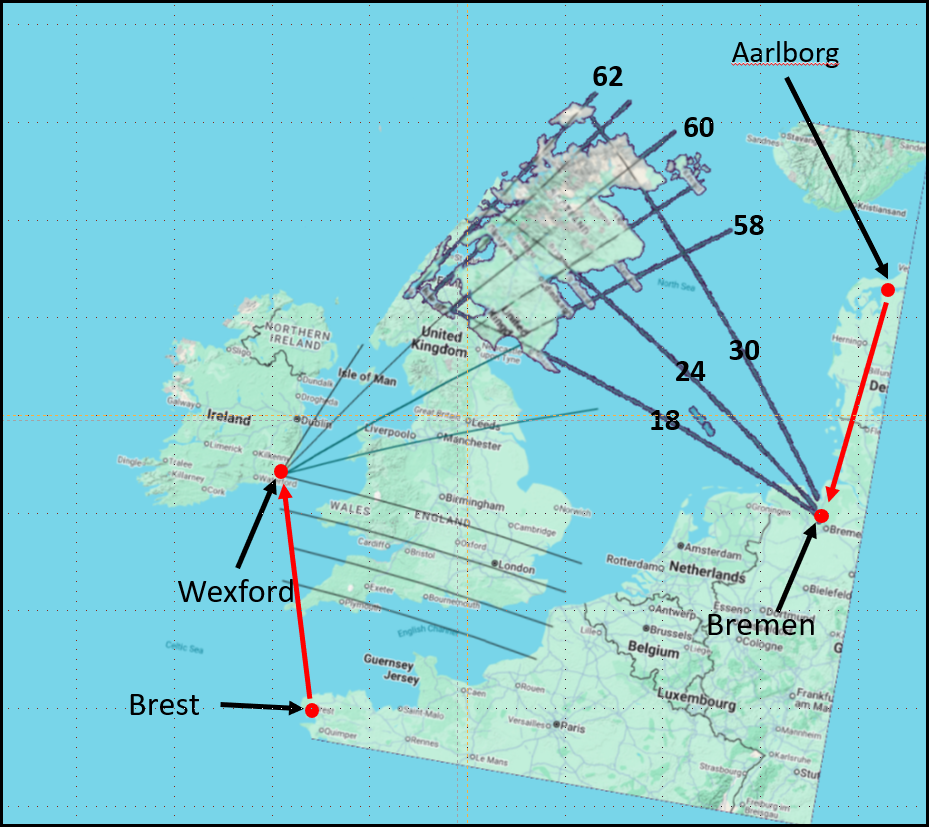
This map shows what happens if Scotland is mapped according to the Hibernia and Albion maps with latitudes from Wexford and the longitudes from Bremen. And the rest of the UK and Ireland mapped from Cadiz and Wexford.
It now looks similar to Bill Theyer's map albeit with more accurate data, so my assumption is that my theoretical locations the Romans used to map this area are close to the real ones.
It is possible that Bremen wasn't the eastern point but was around the end of the Limes near Nimagen, but this would scale Scotland down a bit
| The Caledonian Hinge & The Pytheas Conflict ▲ |
|---|
|
For centuries, cartographers have been baffled by why Ptolemy's map of Caledonia (Scotland) is bent ninety degrees to the east. Rather than a corrupted manuscript or a broken Roman compass, the rotation was a classic data-stitching error. Ptolemy was working with highly accurate, 400-year-old maritime data inherited from the Greek explorer Pytheas of Massilia, who had meticulously mapped the North Atlantic using a real-world baseline running from Brest (France) to Aalborg (Denmark).
However, Ptolemy did not know the exact originating anchor points Pytheas had used. Looking at his own map of the northern world, Ptolemy mistakenly assumed Pytheas's data points were Wexford (Ireland) and Bremen (Germany). Because the distance between Wexford and Bremen is strikingly close to the Brest-Aalborg line, the raw numbers seemed to fit perfectly. By forcing an itinerary that was measured on a French-Danish axis to snap onto an Irish-German axis, the geometric grid experienced a catastrophic rotational shear. To honor Pytheas's real-world distances while anchoring them to the wrong locations, the math forced the vertical landmass of Scotland to swing ninety degrees onto its side.
| | |
|---|
Conclusion ▲ |
|---|
I believe that the data for Hibernia and the South of England were measured from Cadiz.
The northern part of England and Wales were plotted using Wexford and the Inchitutil Fort in Scotland(or more likely its harbour at Bertha).
Finally that the plot of Scotland was created using Pytheas data, but with the incorrect assumtions that the two points he had referenced were Wexford in Eire and Bremen in Germany.
If all the above assumptions are true, then we can deduce that Pytheas most likely travelled from Marseille to Cadiz the Brest and up to Aalborg before sailing round Scotland and probably up to Iceland.
This structural error provides definitive proof of a major historical reality: this data was not collected by the Roman Navy. Had the fleet of Governor Agricola surveyed these waters, the Roman military would have known exactly which imperial forts and coastlines they were measuring from. Instead, Ptolemy's map of Scotland is an attempt to force ancient Greek deep-sea exploration data into an incorrectly anchored Roman coordinate framework. With this final piece of the puzzle, our reverse-grid methodology completes a unified theory for the three major anomalies of Roman Britain:
Ireland (Hibernia): Distorted because it was measured out from a single fixed tracking sentinel at Wexford. England (Albion): Tied seamlessly to the Cadis baseline, exposing the massive 2nd-century naval shipyard at Pevensey as the true identity of Novus Portus. Scotland (Caledonia): Flipped 90 degrees because its independent Greek naval itinerary was snapped onto a mistaken Wexford-Bremen axis.
|
|
|
;)
)
)
)